UEVR: An Exploration of Advanced Game Hacking Techniques
praydog / July 2023 (9023 Words, 51 Minutes)
-
Disclaimer: Most of what is talked about here is not new, and has been used in the security industry for a long time. This article is meant to show how these techniques can be used to locate functions, variables, and structure offsets within games, rather than identify malware.
-
Disclaimer 2: This article assumes an x86-64 binary target, compiled under Windows, using the Microsoft Visual C++ compiler. Some of the techniques may not be applicable to other platforms/compilers, or may require some modifications.
The sphere of game hacking and modding has a rich history, tightly knit with a well-known practice called AOB (Array of Bytes) scanning, also known as signature scanning. This method, similarly employed within the realm of security, is a traditional approach used to detect malicious code or, in the context of modding and hacking, locate specific areas within a program’s memory.
In the realm of security, there exists a suite of techniques encompassing static, dynamic, and heuristic analysis. For the purpose of this discussion, we’ll refer to this group of methods as “binary analysis”. The question: could we leverage these techniques to create more robust code scanning techniques? This isn’t about superseding signature scanning; instead, it’s about broadening our capabilities, adding more depth to our strategies.
Automated binary analysis, static and dynamic, while not a novel approach, is sometimes applied within the game hacking community but is less frequently discussed. However, when used appropriately, these techniques can offer a powerful enhancement to - or even an alternative for - traditional AOB scanning. There are other reasons why these techniques would be used, but that is not the focus of this article.
Many of the techniques described here require the reader to have already identified areas of interest via something like IDA Pro, x64dbg, Cheat Engine, or other tools. From there, we will use automated techniques to locate these areas of interest, such as functions, global variables, or structure offsets.
Let’s start by introducing a practical project that demonstrates these advanced techniques in action. The Unreal Engine Virtual Reality project (UEVR) is a real-world initiative I’ve been working on that uses many of the techniques described in this article.
A Real World Project
Theory is great, but it’s not very useful without practical application.
That’s why there is a project I have been working on that uses many of these techniques. It’s meant to work on almost any Unreal Engine game. It adds 6DOF VR support to as many Unreal Engine games as possible, with little to no intervention required for the most part on the user’s end (kind of like an emulator in an ideal state).
Using many of the techniques described here, it is possible to make such a project. It’s called UEVR. This project has been my playground for experimenting with these techniques, and it’s been a great learning experience.
For information on just how many games (hundreds confirmed at the time of writing) it works on, and to what degree, see the compatibility list.
The core goals of UEVR
- At a base level, it must at least provide full 6DOF head tracking and stereoscopic rendering
- The game UI must be corrected and displayed in world space
- It must be robust, and work on as many Unreal Engine games as possible
- It must be easy to use, and not require any technical knowledge to use (inject and mostly forget)
- There may be cases with extremely problematic games where this might not be the case, but it should be the exception, not the rule
- It must be performant, and not cause any noticeable performance impact on the game
- However, VR in and of itself is a performance intensive task, so there will be some performance impact
- However, care is taken so the core code is performant
- The project takes advantage of using the native stereo rendering pipeline built into UE by default, so this is already an optimization
- It must be extremely generic, and not require any fixes for specific games, and only operate on the assumption that the target is operating under the Unreal Engine
- Provide modders with an API to add motion controller support (Blueprint and C++)
- Provide the user with ways to tweak their experience, and to fix game specific issues that may arise
- An in-game menu with controller support to tweak settings
- Options to choose OpenVR or OpenXR
- Common CVars to fix issues, or enhance the experience
- Multiple rendering methods to choose from to fix things like rendering issues or crashes
- Ways to tweak the world scale, camera offset
- Features such as Decoupled Pitch to reduce motion sickness
- A homebrew console that has access to all of the CVars, and not just the common ones, as well as the commands of the Unreal Engine
UEVR uses the following libraries:
- safetyhook for function hooking (inline and mid-hooks)
- bddisasm and bdshemu for disassembly and emulation
- kananlib which is a library I helped write which contains many of these techniques
Click here to see an overview of the techniques used in UEVR, and how it works in general
Piggybacks off of a built-in Unreal Engine command-line mechanism called -emulatestereo which “emulates” a stereo device, splitting the desktop screen in two with two cameras at separate positions
-emulatestereouses a built-in class calledFFakeStereoRenderingwhich inherits fromIStereoRendering, which UEVR aims to hook- For reference,
IStereoRenderingcontains virtuals relevant to creating a proper stereoscopic image, these include:- A method for overriding the projection matrices
- A method for overriding the view matrices (rotation via euler angles, position via vec3)
- A method for modifying how the viewport is presented (left/right eye width/height/x/y)
- A method for creating a texture as a viewport render target
- The default
FFakeStereoRenderinginterface does not implement this - This allows the VR headset to get a full resolution image at the runtime’s requested resolution
- Using dynamic analysis from the return address of this virtual, we can locate the real function that creates textures
- For context, if our function returns
false, the engine falls back to its own texture creation method - This is also abused to create our UI render target at the same time
- For context, if our function returns
- The default
String reference analysis is used in several places to find the relevant structures and functions for this process
- For its initial starting and anchor points, it uses string reference scanning to locate:
- The
GEngineglobal object- The
"CALIBRATEMOTION"string has always been referenced near a reference toGEnginesince early in UE4 development - Finds the function start where this string is referenced in and looks for global variables via static analysis
- This is the
UGameEngineinstance - Contains the
StereoRenderingDeviceobject among other things - Needed to call
InitializeHMDDeviceto create anFFakeStereoRenderinginstance
- The
- The vtable for
FFakeStereoRendering- There are various configuration strings referenced within the constructor for
FFakeStereoRendering - Finds the function start where these strings are referenced and looks for a
LEAinstruction via static analysis - There are some cases where it appears to have been #ifdef’d out, but this is extremely rare
- If this happens, UEVR will manually construct a plausible
IStereoRenderingvtable and use that instead
- If this happens, UEVR will manually construct a plausible
- There are various configuration strings referenced within the constructor for
- The function for
UGameEngine::InitializeHMDDevice- There is a reference to the string
"emulatestereo"and a reference to the CVar forr.EnableStereoEmulationin this function - This allows us to create an
FFakeStereoRenderinginstance without telling the user to use-emulatestereo- A few methods are used to achieve this, the main one is forcing
r.EnableStereoEmulationto1 - The other is tricking the game into thinking
-emulatestereowas passed in as a command-line argument via code-patching
- A few methods are used to achieve this, the main one is forcing
- After this is called, we can bruteforce scan for the
FFakeStereoRenderingvtable we found earlier inside of the globalGEngineobject to obtain the object and offset - Alternatives/fallbacks are in place to auto-locate the offset in
UGameEnginefor theStereoRenderingDevicefor manual creation if either one of these processes fail
- There is a reference to the string
- The
Tries to minimize use of plain AOBs (signatures)
- Only uses them when necessary
- Only uses them in a localized scenario (such as within the bounds of a function or near an anchor point)
- Instead relies mainly on string refs, and prefers disassembly
- Unique string references are preferred, but not required (strings that are referenced in only one place)
- Strings are human readable, easier to maintain, more likely to reside within the binary through updates, and are less likely to change
Using several of these techniques, UEVR analyzes the FFakeStereoRendering vtable and identifies the relevant vtable indices (which has changed a lot over the years of Unreal Engine development)
- A few of the ways it finds relevant virtual functions to replace:
- Emulation
- This is necessary to deal with obfuscation, it has been seen in the wild on these virtuals
- Obfuscation seen ranged anywhere from a simple
jmpwrapper to multiple layers of control flow obfuscation to simplyreturn true
- General disassembly
- Signature scanning
- Presence of references to specific strings
- Presence of calls to imports like
tanfortan - Presence of a large amount of xmm registers
- This also detects UE5 based on usage of double precision xmm instructions
- Heuristic analysis and anchor points
- Like assuming that a certain virtual lies a specific distance from another if things like:
- Multiple or single functions return
nullptrin a row preceding it - Multiple or single functions return
trueorfalsein a row preceding it - Multiple functions mix
nullptrandtrue/falsereturns, forming a unique pattern
- Multiple or single functions return
- Like assuming that a certain virtual lies a specific distance from another if things like:
- Emulation
It replaces the relevant vtable indices with hooks to its own functions for proper output to a VR headset (using the OpenVR/OpenXR APIs, as well as D3D11/D3D12)
It goes even further by using these techniques in several different ways such as
- Using the return addresses or call stack of some of the virtual functions as anchor points to:
- Find other functions, variables, and offsets of interest
- Find the local player object by using call stack analysis, data flow analysis and mid-function hooks
- This can be found via other methods, but I did not want to construct a completely new method for this
- Relied instead on methods I already had in place, taking advantage of the fact that some of the virtuals in the vtable are called from functions where the local player is the
thispointer
- After the local player is found, its vtable is bruteforced to locate the
PostInitPropertiesfunction- Using path exhaustive disassembly, it checks for references to the
GEngineglobal, it’s the only function that does this within the vtable- This method is necessary because it doesn’t always reside within the first call stack level
- When calling this function, a vectored exception handler must be setup to catch exceptions that occur on development/debug builds of games
- It also goes even further and tries to patch out any exception-causing calls and instructions beforehand through path exhaustion
- This is because the engine will assert if a view state is already created for any eye (so, if this function was called already)
- Calling this function will create the second view state for the other eye, so we don’t crash when doing stereo rendering
- This function is normally called by the engine when enabling VR or using
-emulatestereoimmediately when the game starts, but not at any point afterwards
- Using path exhaustive disassembly, it checks for references to the
- Find and hook the texture creation function in combination with mid hooks
- In particular, this is achieved by performing emulation and disassembly after the return address of
IStereoRenderTargetManager::AllocateRenderTargetTexture, placing the mid hook right before the call to the creation function, as well as after - This is used not only to create our viewport render target, but to create our UI render target as well
- In particular, this is achieved by performing emulation and disassembly after the return address of
- Find the calling function or walk the callstack
- Insert other hooks on areas of interest (inline and mid hooks)
- Locates and hooks
UGameEngine::Tickin a few ways:- Multiple string reference options
- Vtable analysis after locating
UEngine::Tickpure virtual as a reference point - In extreme cases it can try hooking it via call stack analysis from the
UGameViewportClient::Drawhook if all fails - Code path exhaustion via static analysis to locate specific strings buried deep within the function like
"causeevent="- Does this by disassembling all of
UGameEngine’s virtual functions (after we’ve foundGEngine) - Follows all branches that are possible from a static perspective (hence, path exhaustion)
- This is necessary sometimes because:
- Compiler optimizations or obfuscation
- Sometimes the string identifying the function is buried beneath several jmps or calls (direct and indirect)
- Locating the start of the function after finding the stringref sometimes fails
- Attempting to use emulation may not cover the specific branch path the string resides in
- Does this by disassembling all of
- This function is very important which necessitates multiple fallbacks
- Locates and hooks
UGameViewportClient::Draw- Looks for a reference to the string
"CanvasObject"in the function - There can be multiple references to this
"CanvasObject"string because:- There can be multiple viewport types
- We only need one specific one, so we have to analyze each function that this string is contained in
- Looks for a reference to the string
- Locates and hooks
FViewport::Drawby analyzing the call stack from aUGameViewportClient::Drawhook - Locates and hooks
FSlateRHIRenderer::DrawWindow_RenderThreadby:- Analyzing where the
Slate.DrawToVRRenderTargetCVar is referenced - If this fails, analyzes the return address of
IStereoRendering::RenderTexture_RenderThreadwhich is directly called withinFSlateRHIRenderer::DrawWindow_RenderThread - This is used to force the game to render the UI to our UI render target instead of the viewport render target
- Done by replacing one of the argument’s member fields with our UI render target temporarily
- This particular field offset is obtained by bruteforce and emulation of all vtables residing within the object
- Done by replacing one of the argument’s member fields with our UI render target temporarily
- Analyzing where the
- Locates the
ViewExtensionsmember ofUGameEngine:- This is done by assuming that it’s fixed distance ahead of the
StereoRenderingDevicemember offset- This can be seen as using the
StereoRenderingDeviceoffset as an anchor point - This assumption was made by seeing that it’s held true for years of Unreal Engine development
- This can be seen as using the
- This particular interface is very powerful and allows us to insert hooks at various points in the rendering pipeline
- This is done by assuming that it’s fixed distance ahead of the
- After locating the
ViewExtensionsmember:- It inserts a dummy vtable that has many variants of the same function using template metaprogramming
- The purpose of this is to locate various functions of interest, based on how the virtual functions are being called, and how often
- It also uses this to bruteforce the offset for the frame count within the
ViewFamilypassed toBeginRenderViewFamilyand others- Detects which offsets that have integer-like values that are increasing by 1 every call
- The frame count is used by UEVR to track the flow of rendering data until DXGI presents the frame
- This mainly allows technologies like the runtime’s Asynchronous Reprojection to work correctly
- After these steps are done, it inserts the final vtable with the indices found from the analysis
- Locates and hooks the
FSceneViewconstructor- There are two strings in this function,
"r.TranslucentSortPolicy"and"vr.InstancedStereo" - This is a bit complex though, because
"r.TranslucentSortPolicy"is actually referenced in multiple functions - Also, the
"vr.InstancedStereo"string isn’t guaranteed to be at the same call stack level as the other string- It’s sometimes nested within a call inside the constructor
- Because of this, we need to locate all
"r.TranslucentSortPolicy"references, and then analyze each function to see if it contains the"vr.InstancedStereo"string- We do this by exhaustively disassembling each function and following all possible branches until we find an instruction that references the
"vr.InstancedStereo"string
- We do this by exhaustively disassembling each function and following all possible branches until we find an instruction that references the
- There are two strings in this function,
- Uses static and dynamic analysis to locate virtual function indices for the
IConsoleVariablevtable- After locating a CVar, the vtable is bruteforced and analyzed to find the indices of functions that are used by the engine
SetGetIntGetFloatExecute(For IConsoleCommand)
- After locating destructor-like function(s), these functions are known to be ahead of them
- Through behavior analysis and heuristic guesswork, the indices of the functions are found
- After locating a CVar, the vtable is bruteforced and analyzed to find the indices of functions that are used by the engine
Utilizes several fallback techniques in-case the main techniques fail such as:
- Hardcoded vtable indices in extreme cases based on PDB dumps of compiled release builds of Unreal Engine
- Detection of different texture creation methods and accounting for them
- Detection of older UE games based on how the virtual functions are laid out
- This can manifest in several ways
- Missing virtual functions
- Repeating virtual functions (such as multiple nullptr returns in a row followed by a valid function)
- This can manifest in several ways
- Bruteforces through the texture vtable to find certain functions (such as those that return an
ID3D12Resourcepointer)- It does this by checking if the returned pointer’s vtable resides within any of the DirectX DLLs
- Bruteforces through certain structures to find offsets based on what they point to
- All of these analysis techniques are used instead of using PDB dumps because various factors can cause differences in shipped code and PDB dumps
- This includes compiler optimizations, obfuscation, and other factors such as adjustments made by the game developers
Finds other non-essential things such as:
- The
GUObjectArrayglobal variable- Searches for two strings that must reside in the same function
- This is an extremely precise heuristic, especially when dealing with multiple string refs for one string
- These strings have been present in the engine for years
- Fully disassembles the function, looking for displacements
- Uses structure analysis against each displacement to probe for the
GUObjectArrayglobal variable- Checks that integer values in the structure look like integers
- Checks that the pointer to the objects is a valid pointer
- Checks that the first element of the array is a valid pointer and points to a valid vtable
- Once a suitable candidate has been identified:
- Goes even further and detects <= UE 4.10 (which is an inlined array) through similar structure analysis
- Goes even further and checks for the chunked variant of the array through similar structure analysis
- Detects the distance between
FUObjectItemelements via bruteforce scanning for valid pointers toUObjectBase
- Searches for two strings that must reside in the same function
- Bruteforces offsets for various
UObject,FField,FProperty, etc… structures- Uses known structure relationships to probe for offsets
- The
FName::ToString()function- Easily found via multiple string references
- Can sometimes be inlined, so there are fallbacks in place
There are various other techniques used, but they are too numerous to list here or the intricacies are too complex to explain in a short summary
Overall, in essence: tries very hard to recreate what the official VR plugins for the Unreal Engine do, without requiring the game to include them
For context: the official VR plugins are what allow the engine to render to the HMD properly in the first place, they act as a bridge between the engine and the HMD SDKs
A Brief History of Signatures
AOB scanning, or signature scanning, have long been used as a means to locate specific areas in a program’s memory. The technique consists of identifying unique sequences of bytes that correspond to certain operations or data. This practice, which started in the field of antivirus software, quickly found its way to the modding/hacking community, where it became an essential tool. These sequence of bytes can be a function prologue, a magic number, a specific string, and many other things.
One such industry tool that employs signatures is YARA, a versatile malware identification and classification tool. YARA leverages signatures as part of its sets of rules that identify malware based on binary or textual patterns. The use of signatures, while effective in some scenarios, often encounters issues when dealing with complex game updates, function changes, engine differences, or compiler changes, mainly due to its rigidity and specificity.
Binary Analysis in the Security Industry
Unlike AOBs, binary analysis isn’t dependent on specific byte patterns. Instead, it examines the structural and behavioral patterns in a program. In cybersecurity, binary analysis is used to detect unknown viruses or malware by looking at how they behave or how they are structured, instead of looking for a known virus signature. It’s also used to perform formal verification of software, which is the process of proving or disproving the correctness of a program with respect to a certain formal specification or property. Software like BAP is used to perform formal verification of software.
The implementation of binary analysis is broad and ranges from simple static binary analysis to more sophisticated techniques such as emulation, symbolic execution, taint analysis, control flow analysis, and more. These techniques can be used to locate specific areas of interest in a way that is resistant to updates and changes.
Bridging the Gap
Historically, the game hacking community is well-known for using techniques seen in the wild well before research from the security industry is released. However, despite the potential benefits, the adoption of automated binary analysis for locating key areas has been slow: it is complex, and some may see it as overkill.
The community often prefers AOBs for their simplicity, but advanced modders might find binary analysis a potent addition to their arsenal, especially if working with a prolific game engine, or if the game is frequently updated and more robust techniques are needed to locate areas of interest.
A particularly compelling use case for automated binary analysis is with specific game engines that power many games. The technique’s ability to locate shared engine functions can exceed that of a signature if used correctly. Automated binary analysis is generally more resilient to game updates in general, as it’s not dependent on specific byte patterns. However, it’s not a silver bullet, and it’s not without its own set of challenges. It can also be quite slow if not done with care.
Localized emulation of functions, symbolic execution, general disassembly (static analysis) using libraries, data flow analysis, and string reference analysis, offer a solid addition to the modder’s arsenal.
While these techniques are powerful on their own, when some, or all of these techniques are combined, they become powerful tools for locating functions, addresses, and structure offsets that can withstand the test of time.
The Techniques
Emulation
The first thought that usually comes to mind when thinking about emulation is the use of a virtual machine to run a program, or a program to emulate a game console. However, emulation can also be used to run a function in a controlled environment and observe its behavior. This technique is particularly useful when dealing with functions that are difficult to analyze statically.
Given an anchor instruction to start from (this assumes you know how to find this instruction in the first place, for example with an AOB or string reference lookup, even the entry point of the program), we can emulate the function (or set of instructions) and observe its behavior. Along the way, we can look for function calls to other functions of interest, look for specific memory operations (such as accesses of global variables), look for specific values in registers, look for accesses into structures to find specific field offsets, or just trace the flow of data in general.
One can argue that some of those things can just be found simply with a disassembly pass, but here are some counterpoints:
- Some of the operations may be indirect (like accessing memory via a register dereference)
- The function may be too complex to analyze statically (for example, if it’s obfuscated or has many branches)
- There may be a conditional branch which you only want to go a specific way (via setting a register to a specific value, for example), which is where linear disassembly falls short
In C/C++, libraries such as Triton, Unicorn, and bddisasm’s bdshemu can be used to emulate functions.
In Python, libraries such as miasm, Unicorn, qiling, or Triton can be used to emulate functions.
Symbolic Execution
Symbolic execution is similar to emulation in that it runs a function in a controlled environment. However, instead of running the function, it analyzes the function’s code and generates a set of constraints that represent the function’s behavior. This particular technique is not used here, but worth mentioning.
The simplest example I can give here is that symbolic execution has the ability to figure out what inputs can drive a specific function or program to end up at a certain instruction. Example being, product key activation functions, where you can figure out what key will make the program think it’s valid.
The only similar technique we use to this is the enhancement to static analysis to explore all paths.
In C++, libraries such as Triton can be used to symbolically execute functions.
In Python, miasm, angr can be used to symbolically execute functions.
Data Flow Analysis
Data flow analysis is the process of tracking the flow of data in a program. This technique is commonly used in the security industry to track user input and identify potential vulnerabilities. However, it can also be used to track the flow of data in a program and identify specific operations or functions of interest.
In this particular context, given an anchor point (such as a function or instruction), we can “taint” a register or memory location with a magic number and track its flow throughout the code using emulation. This can be used for a few things, such as:
- Behavior verification
- If the taint value flows into a memory write (direct or indirect), we can verify that the piece of code writes to memory if this is what we were looking for
- If the taint flows to, for example, the RAX register after a function call, we can verify that the function returns a value in RAX
- Locating global variables in a specific way
- Proceeding from the previous example, if the taint value (from RAX) flows to a global variable, we can assume this is our target global variable we were looking for. This is quite different than just performing a disassembly or emulation and looking for the first memory write to a global variable, as the analysis will only track the flow of the taint value which could be somewhere after the first seen memory write to a global.
The same libraries used for emulation can be used for data flow and/or taint analysis.
Structural Analysis
Structural analysis, in this context, refers to the analysis of structures (or classes) in a program. This is particularly useful when dealing with C++ programs, as C++ classes are often represented as structures in the binary. This technique is used to locate specific fields in a structure, such as offsets, sizes, and types. It can also just be used to verify that a structure is what we expect it to be.
If we know the general layout of a structure beforehand, we can probe specific areas of memory to see if the structure layout matches. If a structure is supposed to have a valid pointer at 0x10, we can check the offset at 0x10 from a specific pointer, check if it points to valid memory. Combining this with several other checks, like making sure integers look like valid integers, and strings look like valid strings, we can verify that the structure is what we expect it to be.
This technique also works if you know the general layout of the structure, but not the exact offsets within the structure. Using that information, we can perform bruteforce-like checks against the entire structure to obtain the offsets of the fields we are looking for.
An example being, in the UStruct structure in Unreal Engine 4/5, there is a field called SuperStruct. If we have full access to the GUObjectArray already, we can find the:
UStructclassUFieldclassUObjectclass
Using the pointers to these classes, we can scan over the UStruct structure until we see a pointer to the UField class. If we do, we perform the same check on the UField structure until we see a pointer to the UObject class. If we do, we can assume that the SuperStruct field is at the given offset, because all of these classes are supposed to point to eachother via the SuperStruct field.
Static Analysis (Disassembly at Runtime)
Static analysis is the process of analyzing a program’s code without running it. Disassemblers such as IDA, Ghidra, or Binary Ninja are commonly used to perform static analysis. However, in the context of runtime binary analysis, static analysis can be used to analyze a function’s code and look for specific patterns or behavior at runtime using libraries such as:
Using libraries such as these, we can not only perform simple linear disassembly, we can also perform more complex disassembly techniques such as recursive traversal of code paths.
An example, we could disassemble forward, and by using a virtual instruction pointer and list of branches to analyze:
- If a call is seen, we detect this as a branch and add it to a list of branches to be analyzed
- If an unconditional jmp is seen, we replace our virtual instruction pointer with the target address
- If a conditional jmp is seen, we can traverse both paths, and add them both to the list of branches to be analyzed
This traversal technique is particularly useful because:
- The piece of data we’re looking for may be buried deep within a function
String Reference Scanning
String reference scanning is a technique that involves combing through the program’s memory for references to specific strings. In conventional software analysis tools like IDA or x64dbg, cross-references to strings are often used as a reliable method for locating functions during manual analysis. However, leveraging string references within the context of automated runtime binary analysis in the game hacking community is less frequently discussed.
String reference scanning is a form of signature scanning, but due to its reliance on human-readable data, it is more reliable than traditional signature scanning, which usually looks for byte patterns of instructions which may change for a variety of reasons that the original programmer was not even aware of.
Deploying string reference scanning can accomplish several goals:
- It can serve as a structured, human-readable alternative to traditional AOBs
- It can act as a starting point or ‘anchor’ from which other binary analysis techniques can launch
- Once a reference address is identified, it can be used to locate the containing function through a variety of techniques:
- On Windows systems, this could involve using the Exception Directory (a component of the PE file format) or the RtlLookupFunctionEntry function
- Other techniques might include scanning backwards for int3 padding, searching for a function prologue, or scanning until the address is pointed to (non-relatively) by doing a full pointer scan of the module’s mapped memory (indicating a virtual function table)
Disassemblers such as IDA commonly employ this technique to display cross-references to strings. The difference here is it would be performed at runtime. We wouldn’t have the luxury of disassembling the entire program though; this would be too slow, it would have to be a purpose-built scan that employs localized disassembly.
There are some complexities involved because string references on x86-64 are usually relative as part of an instruction operand. So, a special scanning technique that scans the memory byte-by-byte, treating 4 bytes as the “relative” offset, would be required.
// This would need to be used at every address that is scanned for a string reference
// where customOffset is 4
// This assumes that the immediate is the last operand, which is sometimes not the case
// but it's the most common case so it's not really a big deal
uintptr_t calculate_absolute(uintptr_t address, uint8_t customOffset /*= 4*/) {
    auto offset = *(int32_t*)address;

    return address + customOffset + offset;
}
There’s also the issue that this would only give you the address within the middle of the instruction, where the relative operand is. If you need the start of the instruction, you need to get creative. For example, you could have a list of valid prefixes for address references, and scan backwards until you find one of those prefixes, or you could use the technique(s) described earlier that can get you the start of the containing function. From there, you can disassemble forward until the bounds of the instruction encapsulate the address reference.
This same technique can also just be applied to references to any data in general, not just strings. But, since strings are the easiest to scan for from the get-go, it’s a good starting point. If trying to find references to data in general, you would need to know how to find that data in the first place (such as by using or combining the other techniques talked about here).
There is an IDA plugin I wrote a while back which allows the user to click on any address, and it will look for any string references that are near a reference to that particular address. It will only display areas where only the first occurrence of the string reference is near the address. It orders them and displays them in a list based on distance to the target address reference.
Result of using this plugin on the FName constructor in the Unreal Engine
/*
4.27:
[address hidden] + 0x8 NumNetGUIDsPending
[address hidden] + 0x7 SkeletalMeshComponentClothTick
[address hidden] + 0x7 DefaultModulationPlugin
[address hidden] + 0x4 Oculus Quest2
[address hidden] + 0x4 FSequencerPlayerAnimSequence
[address hidden] + 0x4 EndPhysicsTick
[address hidden] + 0x4 StartPhysicsTick
[address hidden] + 0x4 TickAnimationSharing
[address hidden] + 0x4 LakeCollisionComponent
[address hidden] + 0x4 SkeletalMeshComponentEndPhysicsTick
[address hidden] + 0x4 Behavior
[address hidden] + 0x4 FSlateMouseEventsMetaData
[address hidden] + 0x4 FSlateCursorMetaData
[address hidden] + 0x4 SoundExporterWAV
[address hidden] + 0x4 FReflectionMetaData
[address hidden] + 0x4 GameDefaultMap
[address hidden] + 0x4 Test FName
[address hidden] + 0x4 WaterBodyCollision
[address hidden] + 0x4 WidgetTree
[address hidden] + 0x4 FTagMetaData
[address hidden] + 0x4 FSlateToolTipMetaData
[address hidden] + 0x4 ParticleSystemManager
[address hidden] + 0x4 Plugins
[address hidden] + 0x4 FNavigationMetaData
[address hidden] + 0x4 FSceneViewExtensionContext
*/

/*
4.14:
[address hidden] + 0x8 bIsPlaying
[address hidden] + 0x8 FLandscapeUniformShaderParameters
[address hidden] + 0x8 STAT_ColorList
[address hidden] + 0x7 OPUS
[address hidden] + 0x4 LightComponent
[address hidden] + 0x4 FPostProcessMaterialNode
[address hidden] + 0x4 SoundExporterWAV
[address hidden] + 0x4 Component
[address hidden] + 0x4 STextBlock
[address hidden] + 0x4 FLightPropagationVolumeSettings
[address hidden] + 0x4 CraneCameraMount
[address hidden] + 0x4 Priority
[address hidden] + 0x4 FTagMetaData
[address hidden] + 0x4 FNavigationMetaData
*/

/*
Present in both (and 5.0.3+):
+ 0x4 FTagMetaData
+ 0x4 FNavigationMetaData
*/
Heuristic Analysis
Heuristic analysis is essentially inferring something about a program given specific patterns or behavior. This is a very broad term, and can be used to describe a lot of things, and some of the techniques talked about so far can fall under this umbrella, or be used in the process of heuristic analysis. It can be used to describe rule of thumb techniques which make educated assumptions, can have a good chance of working, though are not guaranteed to work.
For example, a heuristic for locating a specific global variable in a game engine could be to look for a function that contains a specific string reference, and checking the most accessed global variable inside the function using static analysis, and assuming this is what we’re looking for. We came up with these specific rules by analyzing a few different sample binaries, and the source code of the engine.
This can describe the offline process (such as manual analysis in IDA) AND the automated techniques we will need to use at the same time, providing instructions to two different groups of reverse engineers. This very specific example will be explored down below.
Call Stack Analysis
Another powerful technique that is especially useful for finding anchors to use for other techniques is call stack analysis. We can use Windows functions like RtlCaptureStackBackTrace to do this.
The call stack shows us the chain of calls that got us to a particular function. It’s a list of return addresses. Note, there must be hook on this function or the thread must be intercepted in some way to get the call stack.
Using these return addresses we can:
- Use them as anchors to scan for other things using the techniques described previously
- Locate the function they are contained in
- Locate the function that called the function they are contained in (and so on…)
Anchors
Anchors, or reference points, in the context of both exploit development and game hacking, refer to specific points or references within a codebase or memory space that serve as starting points or ‘fixed’ locations for further code analysis or manipulation. These anchors could be functions, global variables, return addresses, or essentially any identifiable piece of code or data.
In the realm of exploit development, anchor points play a crucial role, especially when dealing with mitigations like Address Space Layout Randomization (ASLR). ASLR randomizes the memory locations of key data areas, making it more difficult for attackers to predict where in memory their payloads or shellcode will reside. Here, the concept of an anchor or ‘fixed’ point is invaluable, allowing an attacker to navigate the memory space in a deterministic manner, despite the randomization.
When talking about signatures in the context of game hacking, they are usually used to scan through an entire module. If scanning from an anchor point, and limiting the size, it can drastically reduce false positives, and can also allow the signature to be smaller.
Anchor points can also apply to offsets or virtuals. We can sometimes assume that an offset to a member, or a virtual index can sometimes precede or be ahead of another offset/virtual index based on previous analysis.
One may ask: “Well, how do I find an anchor in the first place?”
There’s a few different ways:
- AOB (signature) scanning
- This is the most common way to find an anchor, and is usually used to find a function’s prologue
- String reference scanning
- The callstack from a function hook
- Virtual function tables
- Leveraging RTTI-like systems or scripting systems built into the game engine
- We can use the functions or other data these expose as anchors
- For example, engines like Unity (and the RE Engine! Check out my REFramework project) use Mono and IL2CPP which expose most of the game’s classes and functions to the C# API. These functions can be used as anchors to find non-exposed (native) functions and data that they reference within the function’s code.
- Engines like Unreal expose many classes and methods to the Blueprint API, however it is far less than Unity, which makes this a much more compelling use case to find non-exposed functions and pieces of data residing within them.
- Some engines use an embedded scripting language such as Lua, notable examples include
- Source Engine (1 & 2)
- Apex Legends
- Counter-Strike: Global Offensive
- Dota 2
- Garry’s Mod
- Cyberpunk 2077 (See CyberEngineTweaks which takes advantage of this)
- NieR: Automata (See AutomataMP which takes advantage of this)
- All of the Souls games incl. Elden Ring and Sekiro
- Source Engine (1 & 2)
An interesting note: when enough anchors are gathered, the need for signatures is reduced. This is because the anchors can be used to find other anchors, and so on. This is a very powerful concept, and is the basis for a lot of the techniques described here.
A Practical Example: String Reference Scanning for Anchors, Static and Heuristic Analysis
Take this function for example, which is robust enough to work across hundreds of UE4/5 games. It’s a function that finds the IConsoleManager interface, which is used to interact with the game’s console.
namespace detail {
sdk::FConsoleManager** try_find_console_manager(const std::wstring& string_candidate) {
    SPDLOG_INFO("Finding IConsoleManager...");

    const auto now = std::chrono::steady_clock::now();

    const auto core_module = sdk::get_ue_module(L"Core");
    const auto candidate_string = utility::scan_string(core_module, string_candidate.c_str());

    if (!candidate_string) {
        SPDLOG_ERROR("Failed to find {} string", utility::narrow(string_candidate));
        return nullptr;
    }

    const auto candidate_stringref = utility::scan_displacement_reference(core_module, *candidate_string);

    if (!candidate_stringref) {
        SPDLOG_ERROR("Failed to find {} stringref", utility::narrow(string_candidate));
        return nullptr;
    }

    SPDLOG_INFO("Found {} stringref: {:x}", utility::narrow(string_candidate), (uintptr_t)*candidate_stringref);

    // This might need to be improved a bit, it can be insanely slow on obfuscated builds
    const auto containing_function = utility::find_function_start_with_call(*candidate_stringref);

    if (!containing_function) {
        SPDLOG_ERROR("Failed to find containing function");
        return nullptr;
    }

    // Disassemble the function and look for references to global variables
    std::unordered_map<uintptr_t, size_t> global_variable_references{};
    std::optional<std::tuple<uintptr_t, size_t>> highest_global_variable_reference{};

    utility::exhaustive_decode((uint8_t*)*containing_function, 20, [&](INSTRUX& ix, uintptr_t ip) -> utility::ExhaustionResult {
        if (std::string_view{ix.Mnemonic}.starts_with("CALL")) {
            return utility::ExhaustionResult::STEP_OVER;
        }

        // Checks if the instruction can possibly return a displacement, and if it does, resolve it
        // an example could be "mov rax, [rip + 0x12345678]" where the displacement is rip + 0x12345678 (an absolute address)
        const auto displacement = utility::resolve_displacement(ip);

        if (!displacement) {
            return utility::ExhaustionResult::CONTINUE;
        }

        // hinges on IConsoleManager actually being constructed and assigned
        if (!IsBadReadPtr((void*)*displacement, sizeof(void*)) && !IsBadReadPtr(*(void**)*displacement, sizeof(void*))) {
            global_variable_references[*displacement]++;

            if (!highest_global_variable_reference || global_variable_references[*displacement] > std::get<1>(*highest_global_variable_reference)) {
                highest_global_variable_reference = std::make_tuple(*displacement, global_variable_references[*displacement]);
            }
        }

        return utility::ExhaustionResult::CONTINUE;
    });

    if (!highest_global_variable_reference) {
        SPDLOG_ERROR("Failed to find any references to global variables");
        return nullptr;
    }

    SPDLOG_INFO("Found IConsoleManager**: {:x}", (uintptr_t)std::get<0>(*highest_global_variable_reference));
    SPDLOG_INFO("Points to IConsoleManager*: {:x}", *(uintptr_t*)std::get<0>(*highest_global_variable_reference));

    const auto diff = std::chrono::duration_cast<std::chrono::milliseconds>(std::chrono::steady_clock::now() - now).count();
    SPDLOG_INFO("Took {}ms to find IConsoleManager", diff);

    return (sdk::FConsoleManager**)std::get<0>(*highest_global_variable_reference);
}
}

namespace sdk {
FConsoleManager* FConsoleManager::get() {
    static auto result = []() -> FConsoleManager** {
        std::vector<std::wstring> candidates {
            L"r.DumpingMovie",
            L"vr.pixeldensity"
        };

        const auto now = std::chrono::steady_clock::now();

        for (const auto& candidate : candidates) {
            SPDLOG_INFO("Trying to find IConsoleManager with candidate: {}", utility::narrow(candidate));
            auto result = detail::try_find_console_manager(candidate);

            if (result) {
                SPDLOG_INFO("Took {}ms to search through all candidates", std::chrono::duration_cast<std::chrono::milliseconds>(std::chrono::steady_clock::now() - now).count());
                return result;
            }
        }

        SPDLOG_ERROR("Failed to find IConsoleManager");

        return nullptr;
    }();

    if (result == nullptr) {
        return nullptr;
    }

    return *result;
}
}
Let’s break this down:
- It scans for the string data inside the Core module that’s passed in as an argument (
"r.DumpingMovie"or"vr.pixeldensity"in this case) - It scans for a reference to that string data
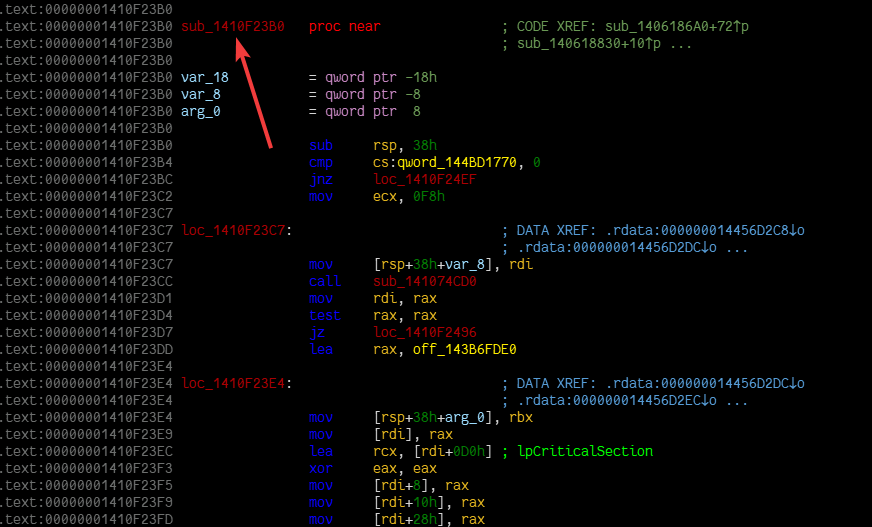
- It locates the containing function of that reference
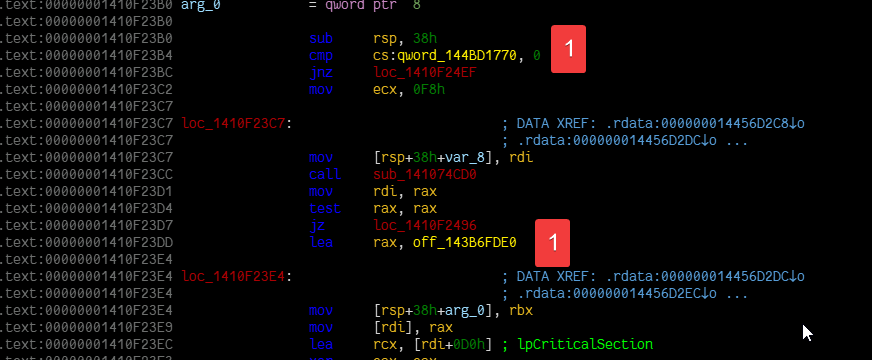
- It disassembles the containing function and looks for references to global variables
- It finds the global variable reference that’s referenced the most, this is likely to be the global variable that holds the pointer to the IConsoleManager instance. This can be considered a form of heuristic analysis, as it’s not guaranteed to work, but it’s likely to work in most cases based on sample binaries analyzed manually prior to writing this function.
From a manual perspective, recreating this entire process from the perspective of a reverse engineer would look something like this:
Phase 1: Find the string data (utility::scan_string in the code)
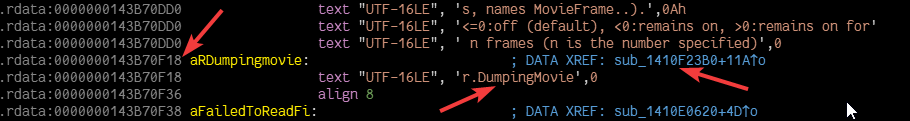
Phase 2: Head to the cross-reference shown in the UI (utility::scan_displacement_reference in the code)

Phase 3: Locate the start of the function (scroll up a bit) (utility::find_function_start_with_call in the code)
Phase 4: Scan through the disassembly listing looking for the most referenced global variable (utility::exhaustive_decode in the code)
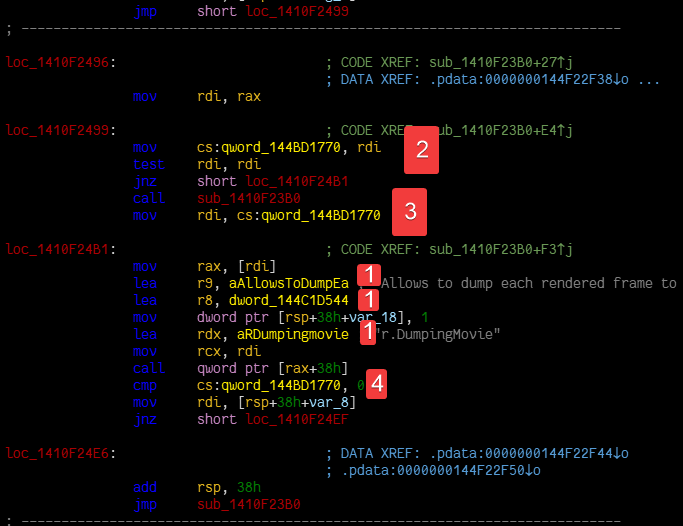
Phase 5: Rename the global variable to something meaningful (returning the result in the code)
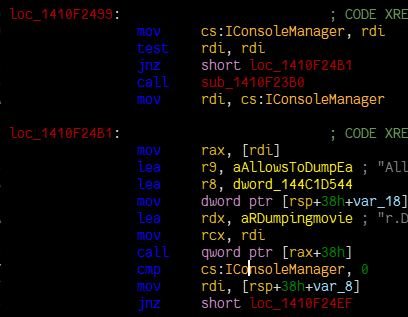
This kind of approach is going for more of a human-oriented approach, where we’re trying to replicate the process a human would go through to find the IConsoleManager instance. Doing it like this allows us to easily maintain the code.
While more complex than an AOB, this set of techniques can be more robust, as it’s not reliant on a specific set of instruction bytes being present in the game’s executable other than the string data itself. Rather, it’s dependent on these strings being referenced by the game’s code, which is much more likely to remain consistent across different versions of the game, no matter how they’re referenced, whether with a LEA instruction, a MOV instruction, or something else entirely. The same goes for the global variables: we’re checking for global displacement references, which can be several different kinds of instructions.
If it fails at any point, we have multiple options to use as the IConsoleManager instance is used in many, many other places near unique strings, and we can simply try again with a different string.
In contrast, while an AOB could work here, it may require multiple variants to be written, not necessarily for each version of the game, but to account for function changes, edge cases, different compiler versions, obfuscated code, and more. It’s also much more likely to break, as it’s dependent on a specific set of bytes (a specific instruction) being present in the game’s executable, which is more likely to change for the reasons stated, and sometimes updates to the game in general can break AOBs. I would argue for using an AOB though if there was a magic constant being used in the function though.
To explain how I came up with these strings to look for, I looked through the source code, and through the disassembly listing in IDA in several samples. I found that these strings were referenced in the same function that the IConsoleManager instance was referenced in.
In Defense of Signatures
While it may seem as if this article is trying to dissuade from using signatures, that’s not the case. Signatures are still a very useful tool in the reverse engineer’s arsenal, and can be used in conjunction with the techniques discussed in this article to improve their effectiveness.
I would still very much advocate for signatures if there was a magic constant being used somewhere in an instruction as well. An example being:
mov eax, 0xdeadbeef
While it’s possible the mnemonic may change, or the bytes may partially change, the constant referenced within it may remain the same, and can be used as a signature. I could see a form of obfuscation breaking this assumption, however.
The techniques described here are usually going to be slower than a straight signature scan, and may not be feasible in some cases. The degree varies, and can range anywhere from a few milliseconds to a few seconds, depending on the complexity of the binary. Moreso if it’s obfuscated in some way, which not only bloats the size of the executuable, but also messes up the code, and other things like the Windows exception directory. However, this may be a tradeoff between speed and robustness.
Signatures may also be the only option if the target encrypts all of its strings, has very minimal strings in the first place, there’s no feasible anchor points to work with, or doing deep automated analysis may eat up too much time. These methods are in no way easy to come up with an attack plan either, it may just be easier and quicker to write a signature, it may be the case that there’s not enough samples to come up with a broad set of heuristics either.
There’s also more advanced signature scanning techniques which operate on “nibbles” (4 bits) instead of whole bytes, which can be used to make signatures more robust, and less likely to break. Tools like YARA also have “jump” sequences for their signatures, which can be used to skip over N amount of bytes, within a specific range, which can be used to make signatures more robust as well.
In Closing
The entire point I am trying to get across is that the process of locating certain functions or data structure by a reverse engineer manually in IDA, can be automated in the form of runtime code. If the process taken to get to a specific location manually is broken down by how it was achieved, the same can be achieved in code.
Case in point: If a reverse engineer finds a string reference in IDA that leads them to the function they want, this same exact process can be recreated in code. Even going an extreme step further: If they had to step through the code in a debugger to find the function they want, this same exact process can be recreated in code in the form of emulation or disassembly.
The techniques discussed in this article aren’t intended to displace traditional tools such as AOB scanning, which undeniably hold their unique advantages and a place of importance in the hacker’s toolkit.